
More Information
Submitted: June 23, 2023 | Approved: July 26, 2023 | Published: July 27, 2023
How to cite this article: Bhaisare R, Ravindranath M, Singh G. Role of RBC Parameters to Differentiate between Iron Deficiency Anemia and Anemia of Chronic Diseases. J Hematol Clin Res. 2023; 7: 021-024.
DOI: 10.29328/journal.jhcr.1001024
Copyright License: © 2023 Bhaisare R, et al. This is an open access article distributed under the Creative Commons Attribution License, which permits unrestricted use, distribution, and reproduction in any medium, provided the original work is properly cited.

Role of RBC Parameters to Differentiate between Iron Deficiency Anemia and Anemia of Chronic Diseases
Reena Bhaisare*, Ravindranath M and Gurmeet Singh
JLN Hospital and Research Center, Bhilai, Chhattisgarh, India
*Address for Correspondence: Reena Bhaisare, Pathology Department, JLN Hospital and Research Center, Bhilai Chhattisgarh, India, Email: [email protected]
Introduction: In the present study we evaluated and compared RBC parameters, iron status, and ferritin for discriminating between patients with iron deficiency anemia and anemia of chronic disease. Anemia that accompanies infection, inflammation, and cancer, is commonly termed anemia of chronic disease (ACD).
Methods: We compared the ability of serum ferritin concentration, using the microplate immunoenzymometric assay method with other, more traditional indicators of iron status like total iron binding capacity [TIBC], mean corpuscular volume [MCV], percent transferrin saturation [%TS], RBC distribution width [RDW], and serum iron concentration [SIC]. The ferritin concentration was determined in 80 serum samples selected from men and women above the age of 18 years. The patients were assigned to IDA and ACD groups based on serum ferritin concentration.
Observation: By studying the ROC Curve for various red cell parameters for the diagnosis of IDA and ACD, we found that diagnostic accuracy of various indicators was as follows TIBC>TS%>MCV>MCH>SI>MCHC for anemia of chronic diseases, and TIBC>MCH>MCV>MCHC>TS%>SI for iron deficiency anemia. When both the value of AUCs (Area under Curve) of ROC were compared it is apparent that TIBC, TS%, MCV, and MCH are important discriminating factors between IDA and ACD.
Conclusion: Conventional laboratory parameters play an important role in distinguishing overt causes of IDA and ACD. MCV, MCH, and TIBC were found to be (p - value < .05) significantly discriminated against IDA and ACD. Serum ferritin is an important diagnostic tool with reasonable accuracy for the detection and differentiation of iron deficiency anemia and anemia of chronic disease.
Iron deficiency anemia is one of the most prevalent anemia in developing countries because iron deficiency is prevalent in these countries. We need to differentiate between iron deficiency anemia and anemia of chronic diseases because iron treatment work well in IDA but the treatment of iron get worsen in Anemia of chronic disease (ACD) because this extra iron gets trapped in storage places like reticuloendothelial cells of the body where already more iron are stored. The most important cause of iron deficiency is lack of food, adolescence, and pregnancy due to increased requirements. (ACD) is a type of anemia that commonly occurs with chronic or long-term illnesses or infections. Cancer and inflammatory disorders, in which abnormal activation of the immune system occurs, can also cause ACD. Low blood iron levels occur in ACD, despite normal iron stores, because inflammatory and chronic diseases interfere with the body’s ability to use stored iron and absorb iron from the diet [1]. Clinical features of Anemia of inflammation and chronic disease develop slowly and, because it is usually mild, may cause few symptoms [1].
This is a prospective comparative study carried out in the Department of Pathology at Jawaharlal Nehru Hospital and Research Center, Bhilai, Chhattisgarh. During a period of 1 year, specimens were obtained from 84 patients. The study was performed on those patients who have been referred by a physician, admitted to different wards of Jawaharlal Nehru Hospital and Research Center, Bhilai, and patients who are referred to medical OPD on regular follow-up observed for several months. Anemia was diagnosed using the WHO recommendation of Hb < 13 g/dl (Males) and < 12 g/dl (Females) [2]. Therefore men with less than 12 g/dl of hemoglobin were included in the study. Only patients about 18 years old were considered.
We used CBC, including values for hemoglobin concentrate, hematocrit, RBC count, and RBC indices like MCV, MCH, MCHC, and RDW - By using COULTER® LH750 Haematology Analyzer. Serum ferritin (SF) value was obtained by Quantitative testing of circulating ferritin concentration in serum by using Microplate Immunoenzymometric Assay Method. Serum Iron Concentrate (SIC) and Total Iron Binding Capacity (TIBC) by using the ferrozine method (SIC and TIBC), Transferrin saturation was obtained by calculation.
Patients whose data was incomplete were excluded from the study and not considered for statistical evaluation.
Statistical analysis
Data was compiled in MX Excel and checked for completeness and correctness. All data were expressed as Mean ± SD. All statistical analyses including one-way analysis of variance (ANOVA), and receiver operating characteristic (ROC) curve analysis, were performed using SPSS software for Windows (Version 16.0). ROC analysis included the calculation of the area under the curve (AUC).
The study was undertaken after getting the clearance of an ethical committee.
During the period of one year a total number of 84 cases of diagnosed anemia, in which 4 patients were excluded from the study. The mean age in our study group was 53.15 ± 17.5. In our study group, most of the patients were clustered in the age group of 51 to 60 years of age (Figures 1,2). The overall percentage for females was 61.2% and for males 38.8%.Interpreting the serum ferritin value was done in which, 20 out of 80 patients were diagnosed as patients of ACD (457 ± 213.7.31) while 25 out of 80 patients were diagnosed as patients as IDA (7.5 ± 4.8). A total of 35 patients out of 80 patients had serum ferritin levels within the normal range so could not be categorized in either of these groups (Table 1).
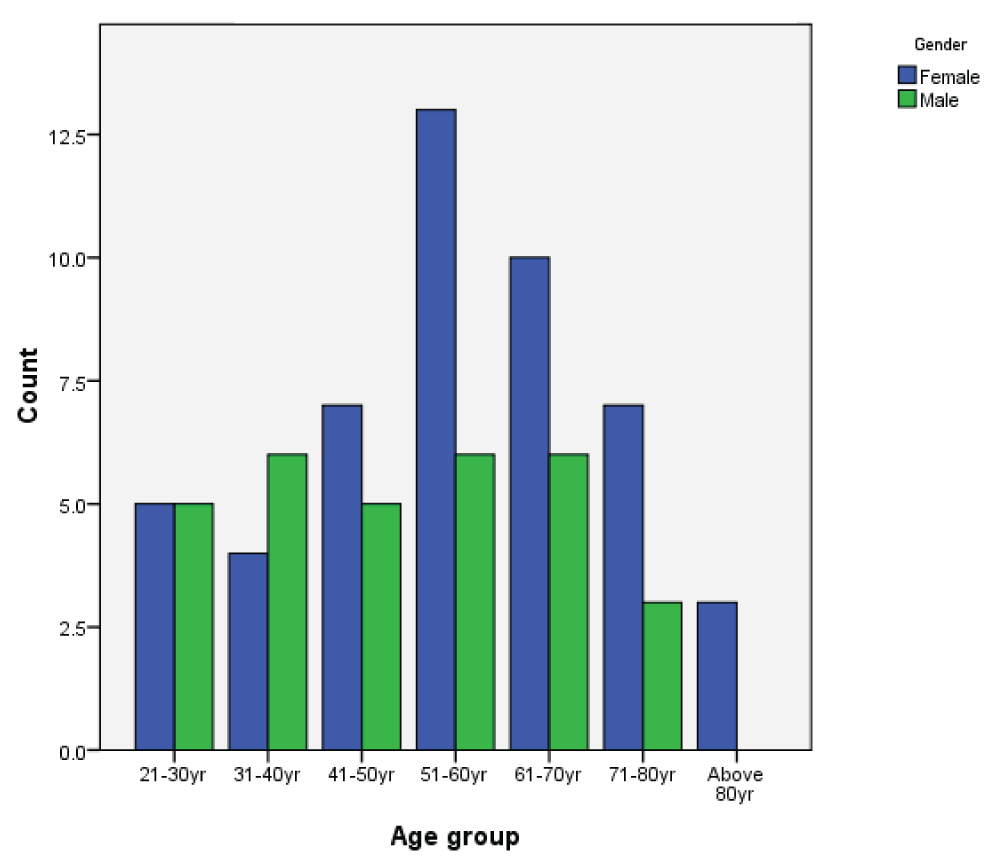
Figure 1: Age and sex distribution among study groups.
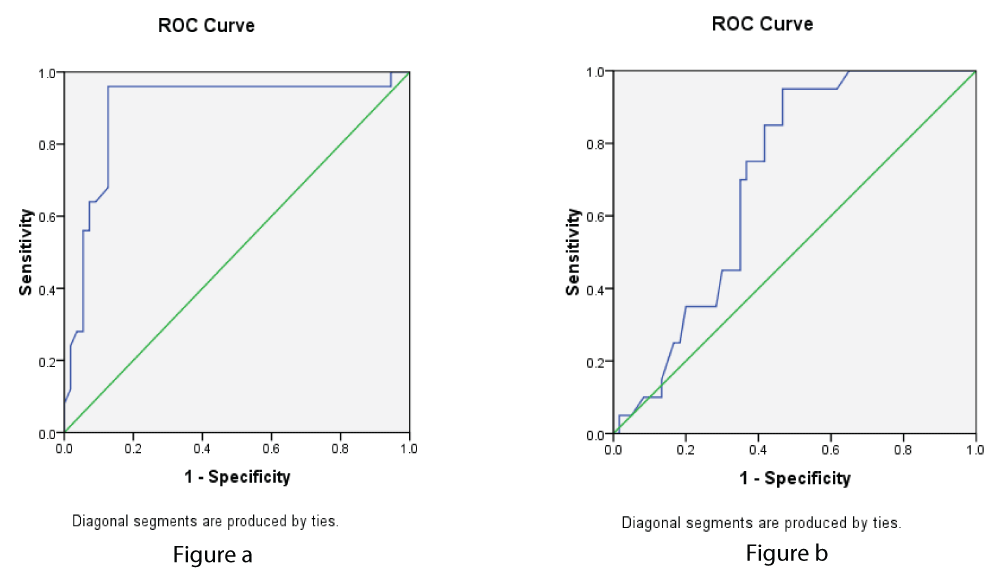
Figure 2: a: ROC curve of TIBC for ACD. b: ROC curve of TIBC for IDA.
| Table 1: Description of study participants as per anemic status. | |
| Iron deficiency anemia(IDA) with serum ferritin < 15 ng/ml | 25 |
| Anemia of chronic diseases(ACD)with serum ferritin > 240 ng/ml | 20 |
| Studied patients who could not be categorized in IDA /ACD group with serum ferritin > 15 ng/ml to < 240 ng/ml | 35 |
Various authors have used serum ferritin levels to make such a categorization [3]. In the present study serum ferritin value < 15 µg/L was used as a cut-off for diagnosing iron deficiency. Goyal, et al. [4] had and used a value < 20 µg/L for the diagnosis of IDA [4]. While others have used < 30 µg/L and < 60 µg/L in various studies [5]. In the present study group maximum population was normocytic normochromic blood pictures. The second large population was microcytic hypochromic.
When both the ROC curves were compared it is apparent that TIBC was an important discriminating factor between IDA and ACD followed by TS%, MCV, and MCH, MCHC. Serum iron was found to be of limited value in the diagnosis of IDA and ACD (Figures 3,4).
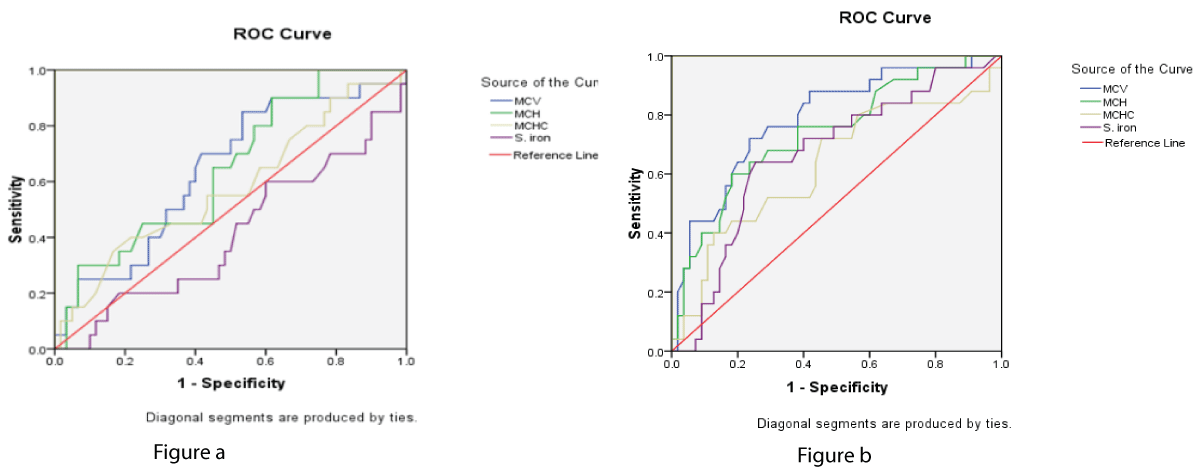
Figure 3: a: ROC curve for MCV, MCH, MCHC and b: S.Iron in the study group of ACD and IDA.
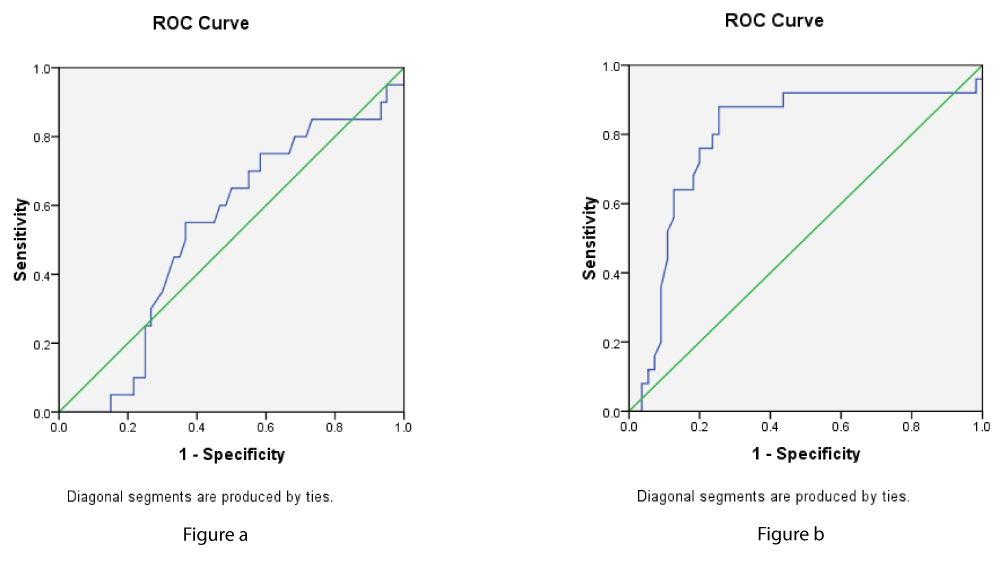
Figure 4: a,b: ROC curve of transferrin saturation in ACD, and IDA.
In earlier studies various authors Wians, et al. [6], Masts, et al. [7] Ahluwalia, et al. [8] have shown that newer tests like serum transferrin receptor study can only complement the traditional laboratory studies of iron status like TIBC, TS%, MCV, and MCH. Our data also establish that conventional parameters do play a role in distinguishing overt cases of IDA and ACD Tables 2,3.
| Table 2: AUC (Area under curve) for MCV, MCH, MCHC, SIC, TIBC, and TS% in a study group of ACD. | |||||
| Area Under the Curve | |||||
| Test Result Variable(s) | Area | Std. Errora | Asymptotic Sig.b | Asymptotic 95% Confidence Interval | |
| Lower Bound | Upper Bound | ||||
| MCV | .641 | .070 | .060 | .504 | .779 |
| MCH | .644 | .068 | .055 | .511 | .777 |
| MCHC | .578 | .076 | .299 | .428 | .728 |
| SIC | .411 | .075 | .237 | .264 | .559 |
| TIBC TS % |
.700 .530 |
.057 .072 |
.008 .685 |
.588 .390 |
.812 .671 |
| Null hypothesis: true area = 0.5 Result: The AUC values for these parameters decreased in the following order for anemia of chronic diseases .700(AUCTIBC).641(AUCMCV)>.644(AUCMCH)>.574 (AUCMCHC).530(AUC TS %)>.411(AUCS.IRON) |
|||||
| Table 3: AUC for MCV, MCH, MCHC, SIC, TIBC, and TS% in study groups of IDA. | |||||
| The area under the curve | |||||
| Test Result Variable(s) | Area | Std. Errora | Asymptotic Sig.b | Asymptotic 95% Confidence Interval | |
| Lower Bound | Upper Bound | ||||
| MCV | .788 | .055 | .000 | .680 | .896 |
| MCH | .737 | .061 | .001 | .618 | .857 |
| MCHC | .630 | .071 | .063 | .490 | .770 |
| SIC | .667 | .065 | .017 | .539 | .795 |
| TIBC | .897 | .044 | .000 | .812 | .983 |
| TS % | .793 | .060 | .000 | .675 | .911 |
| Null hypothesis: true area = 0.5 Result: The AUC values for the above parameters decreased in the following order for iron deficiency anemia .897(AUCTIBC).793(AUCTS%).788(AUCMCV)>.737(AUCMCH)>.630(AUCMCHC)>.667(AUCS.I) |
|||||
The above results of the area under curves by studying the various ROC Curves we found that diagnostic accuracy of various indicators was as follows TIBC>TS%>MCV>MCH>SI>MCHC for ACD, and TIBC>MCH>MCV>MCHC>TS% >SI for IDA, so the diagnosis accuracy was higher in TIBC for both ICD and ACD were higher than other parameters.
In the present study, we also found that 35 out of 80 patients, which could not be categorized either as IDA or ACD, as the ferritin level were within the normal range. In healthy populations elevated ferritin concentration can also increase in certain chronic inflammatory disorders, and is also found to be independent of body iron overload. Serum ferritin is also an acute phase reactant protein and conditions such as fever, infection, inflammatory bowel diseases, and malignancy, increase the serum ferritin concentration [9]. These factors may increase serum ferritin results, which may obscure iron deficiency and complicate the detection of iron overload.
When these 35 patients were further evaluated using the TIBC, MCV, MCH, and TS%, it was found that 11 of these patients had mean values of the TIBC, MCV, MCH, and TS% was 480.2,78.5,24.9, and 8.5 respectively. Since they were found to be good discriminators as mentioned earlier, it can be concluded that these patients are likely to have IDA. In the remaining 24 out of 35 patients using these parameters we were unable to categorize either as IDA or ACD. Macdougall, et al. [10] have used the terminology functional iron deficiency for those patients wherein there is a presence of stainable iron in the bone marrow together with serum ferritin values within normal limits, but there is insufficient iron incorporation in erythroid precursors [10].
Serum Transferrin assay (sTfR) assay was not under-taken. Therefore, we could not assess the utility of sTfR in the present study. Wians, et al. [11] opined that there is no significant difference between TIBC and sTfR in the diagnosis of IDA/ACD. Therefore routine measurements of sTfR offer no advantages over TIBC for discriminating people with biochemically defined IDA and ACD [11].
- Agarwal N, Prchal JT. Anemia of chronic disease (anemia of inflammation). Acta Haematol. 2009;122(2-3):103-8. doi: 10.1159/000243794. Epub 2009 Nov 10. PMID: 19907147.
- World Health Organization. Nutritional Anemias. Technical Report Series No. 405. Geneva, Switzerland: WHO, 1968.
- Wians FH Jr, Urban JE, Keffer JH, Kroft SH. Discriminating between iron deficiency anemia and anemia of chronic disease using traditional indices of iron status vs transferrin receptor concentration. Am J Clin Pathol. 2001 Jan;115(1):112-8. doi: 10.1309/6L34-V3AR-DW39-DH30. PMID: 11190796.
- Goyal R, Das R, Bambery P, Garewal G. Serum transferrin receptor-ferritin index shows concomitant iron deficiency anemia and anemia of chronic disease is common in patients with rheumatoid arthritis in north India. Indian J Pathol Microbiol. 2008 Jan-Mar;51(1):102-4. doi: 10.4103/0377-4929.40417. PMID: 18417876.
- Fleming MD, Trenor CC 3rd, Su MA, Foernzler D, Beier DR, Dietrich WF, Andrews NC. Microcytic anaemia mice have a mutation in Nramp2, a candidate iron transporter gene. Nat Genet. 1997 Aug;16(4):383-6. doi: 10.1038/ng0897-383. PMID: 9241278.
- Wians FH Jr, Urban JE, Keffer JH, Kroft SH. Discriminating between iron deficiency anemia and anemia of chronic disease using traditional indices of iron status vs transferrin receptor concentration. Am J Clin Pathol. 2001 Jan;115(1):112-8. doi: 10.1309/6L34-V3AR-DW39-DH30. PMID: 11190796.
- Mast AE, Blinder MA, Gronowski AM, Chumley C, Scott MG. Clinical utility of the soluble transferrin receptor and comparison with serum ferritin in several populations. Clin Chem. 1998 Jan;44(1):45-51. PMID: 9550557.
- Ahluwalia N. Diagnostic utility of serum transferrin receptors measurement in assessing iron status. Nutr Rev. 1998 May;56(5 Pt 1):133-41. doi: 10.1111/j.1753-4887.1998.tb01738.x. PMID: 9624883.
- Oustamanolakis P, Koutroubakis IE, Kouroumalis EA. Diagnosing anemia in inflammatory bowel disease: beyond the established markers. J Crohns Colitis. 2011 Oct;5(5):381-91. doi: 10.1016/j.crohns.2011.03.010. Epub 2011 Apr 27. PMID: 21939910.
- Macdougall IC, Hutton RD, Cavill I, Coles GA, Williams JD. Poor response to treatment of renal anaemia with erythropoietin corrected by iron given intravenously. BMJ. 1989 Jul 15;299(6692):157-8. doi: 10.1136/bmj.299.6692.157. PMID: 2504356; PMCID: PMC1837074.
- Wians FH Jr, Urban JE, Keffer JH, Kroft SH. Discriminating between iron deficiency anemia and anemia of chronic disease using traditional indices of iron status vs transferrin receptor concentration. Am J Clin Pathol. 2001 Jan;115(1):112-8. doi: 10.1309/6L34-V3AR-DW39-DH30. PMID: 11190796.