
More Information
Submitted: October 22, 2025 | Approved: November 07, 2025 | Published: November 10, 2025
How to cite this article: Bertrand MC, Enone JPM, Senclaire TFP, Astride KN, Claire NEM, Alvine ML, et al. Stability Duration of a Normal Control Pool for Prothrombin Time and Activated Partial Thromboplastin Time Prepared in the Hematology and Blood Bank Service of the Yaoundé University Teaching Hospital, Cameroon. J Hematol Clin Res. 2025; 9(1): 027-034. Available from:
https://dx.doi.org/10.29328/journal.jhcr.1001038
DOI: 10.29328/journal.jhcr.1001038
Copyright license: © 2025 Bertrand MC, et al. This is an open access article distributed under the Creative Commons Attribution License, which permits unrestricted use, distribution, and reproduction in any medium, provided the original work is properly cited.
Keywords: Pooled Plasma; Internal quality control; Prothrombin time (Quick’s time); Activated partial thromboplastin time; Stability duration

Stability Duration of a Normal Control Pool for Prothrombin Time and Activated Partial Thromboplastin Time Prepared in the Hematology and Blood Bank Service of the Yaoundé University Teaching Hospital, Cameroon
Mokou Claude Bertrand1, Juste Patient Mbebi Enone1, Toche Fotso Paul Senclaire2, Koguep Ngongang Astride3, Ngo Etoah Marie Claire3, Makuete Lonkeng Alvine4, Eyoum Bille Bertrand1,5* and Tayou Tagny Claude3,6
1Department of Clinical Biology, Laquintinie Hospital Douala, Douala, Cameroon
2Department of Clinical Biology, Faculty of Medicine and Pharmaceutical Sciences, University of Douala, Douala, Cameroon
3Yaounde University Teaching Hospital, Yaounde, Cameroon
4Department of Biochemistry, Faculty of Science, University of Dschang, Dschang, Cameroon
5Department of Biochemistry, Faculty of Science, University of Douala, Douala, Cameroon
6Faculty of Medicine and Biomedical Sciences, University of Yaoundé I, Yaounde, Cameroon
*Address for Correspondence: Eyoum Bille Bertrand, Department of Biochemistry, Faculty of Science, University of Douala, Douala, Cameroon, Email: [email protected]
Prothrombin Time (PT), also called Quick’s Time (QT), is a coagulation test expressed in seconds, measured in the presence of tissue thromboplastin and calcium ions. Similarly, Activated Partial Thromboplastin Time (APTT) is measured in the presence of phospholipids, an activator, and calcium ions. These two tests are among the most commonly used in hemostasis. Their execution absolutely requires plasma samples used as quality controls, whether commercial or prepared locally (“pooled” in the laboratory).
This descriptive study aimed to determine the stability duration of an in-house control pool for PT and APTT tests, prepared in the laboratory of the Hematology and Blood Bank service of the Yaoundé University Teaching Hospital, Cameroon.
Plasma was collected after centrifugation, mixed, and then frozen at a temperature of -30°C to preserve the coagulation factors, especially the most labile ones. The plasma pool was then aliquoted, stored at -30 °C protected from light in a domestic freezer, and kept for a period of two weeks. A portion of the pool was tested within four hours of collection: 30 PT and APTT analyses were performed.
The assay was performed manually using the tube tilt method. The means obtained were 12.71 seconds for PT and 30.66 seconds for APTT. The acceptability limits (mean ± 2 standard deviations), calculated from the standard deviation, were 11.38 to 14.04 seconds for PT and 27.96 to 33.37 seconds for APTT.
The plasma pool was then analyzed daily in duplicate. The average of the results for each day was plotted on a Levey-Jennings chart and interpreted according to Westgard rules. The results showed that the stability duration of the normal control pool is eight (8) days for PT and seven (7) days for APTT.
In a context marked by a recurrent shortage of quality control reagents, for various logistical and economic reasons, these results offer a reliable alternative to commercial control samples, which are often expensive or unavailable. The use of locally prepared control pools could thus compensate for stock-outs of normal or pathological control reagents supplied by manufacturers.
Blood coagulation is a vital physiological process that prevents hemorrhage by transforming liquid blood into a clot [1]. It forms part of hemostasis, which maintains the balance between stopping bleeding and preserving adequate blood fluidity for circulation.
The main laboratory tests used to evaluate coagulation are Prothrombin Time (PT), Activated Partial Thromboplastin Time (APTT), and Bleeding Time (BT). Each explores a specific pathway of the coagulation cascade, and their accurate interpretation depends on rigorous Quality Control (QC) procedures that ensure analytical precision and accuracy [2].
Two complementary types of QC are implemented in clinical laboratories: Internal Quality Control (IQC), performed daily using control materials, and External Quality Assessment (EQA), conducted periodically by an external body through inter-laboratory comparison [2]. Control materials should closely resemble patient samples, remain stable throughout use, and be homogeneous to ensure reliable results.
In hemostasis testing, plasma used for quality control must be frozen or lyophilized to preserve coagulation factors, especially the most labile ones [2]. However, in many sub-Saharan African settings, the limited availability of commercial control plasma compromises the quality of hemostasis testing. The local preparation of normal plasma control pools for PT and APTT thus represents a practical and cost-effective alternative.
This study aims to evaluate the stability over time of locally prepared control plasma pools at the Yaoundé University Teaching Hospital, in order to support reliable and sustainable hemostasis testing in resource-limited settings.
Awareness and recruitment of participants
An awareness campaign was conducted among students of the School of Medico-Sanitary Technicians in Yaoundé, Cameroon. Targeted individuals were over 21 years old and apparently healthy. The objective was to recruit volunteers for blood sampling used in the preparation of a plasma control pool.
Informed consent and interview
Participants who agreed to participate signed an informed consent form. They then answered a structured questionnaire designed to collect sociodemographic and clinical data and assess eligibility. Objective information about coagulation disorders and the study’s purpose was provided to each participant.
Blood sampling
- Preparation of materials and identification: Each participant received a unique identification code affixed to a tube containing sodium citrate for blood collection.
- Sampling procedure: Venous sampling was performed at the antecubital fossa without the use of a tourniquet, following best practices for the preservation of coagulation factors.
Preparation and analysis of samples
a. Materials and reagents:Materials: micropipettes, stopwatch, water bath, hemolysis tubes, tips, and Eppendorf tubes. Reagents: CYPRESS brand PT/APTT kit (thromboplastin, cephalin, CaCl₂).
b. Procedure for preparing the pooled plasma
Collection: Blood was drawn from 15 eligible volunteers into citrated tubes.
Centrifugation: Samples were centrifuged at 3000 rpm for 15 minutes.
Pooling: Platelet-poor plasmas were combined and homogenized in a common tube.
Aliquoting and freezing: The pooled plasma was divided into 0.5 ml aliquots in Eppendorf tubes and immediately frozen at −30 °C, protected from light.
Initial testing: Thirty (30) PT and APTT assays were performed immediately to establish reference values and construct a Levey–Jennings chart.
c. Stability monitoring: Each day, one aliquot was thawed (2–4 hours) and analyzed following the CYPRESS manufacturer’s protocol to assess parameter stability.
d. Statistical analyses and reliability modeling: Statistical calculations included mean, standard deviation, and coefficients of variation (±1 SD, ±2 SD, ±3 SD). The Levey–Jennings chart was plotted and interpreted using Westgard rules to determine plasma stability duration.
To enhance methodological rigor, the evaluation of plasma stability was conceptually framed within cross-disciplinary reliability assessment models. In particular, reliability principles derived from Markov chain analysis and Reliability Block Diagrams (RBDs) were referenced to illustrate how laboratory systems, like engineered systems, can experience state transitions from optimal to degraded or failed conditions over time. This analogy supports the structured evaluation of long-term analytical performance and provides a theoretical foundation for quantifying stability periods and identifying failure points in the analytical process.
Communication of results
Participants were invited to the Yaoundé University Teaching Hospital to receive their PT/APTT results. Those presenting abnormal values were referred to a specialist for medical follow-up.
Data analysis
Data were securely entered into Microsoft Excel (version 2015) for statistical processing, graphical representation, and generation of stability diagrams.
Ethical considerations: The study adhered to national ethical standards.
Institutional authorization: Deputy Director of the Yaoundé University Teaching Hospital.
Ethical clearance: National Ethics Committee for Human Health Research (CNERSH), Reference N° 2015/11/660/CE/CNERSH/SP.
Written informed consent was obtained from all participants.
Anonymous coding ensured participant confidentiality.
Quality control
- Internal Quality Control (IQC): The IQC provided by the CYPRESS manufacturer was lyophilized and reconstituted with 1 ml of distilled water. After gentle homogenization, it was stable for 48 hours. Before each series of analyses, IQC was tested following the same procedure as the study samples.
- External Quality Assessment (EQA): EQA was conducted in collaboration with the World Federation of Hemophilia (WFH) under the International External Quality Assessment Scheme. Parameters analyzed included PT, APTT, factor VIII, factor IX, and von Willebrand factor using a semi-automated method.
The WFH provided:
Percentage deviation for each parameter,
Laboratory performance evaluations,
Reference results for factor assays,
Cumulative performance grades over three cycles, and Interpretative schemes for PT, APTT, and factor deviations.
The EQA results validated the internal control performance and ensured compliance with international analytical standards.
From a reliability perspective, the combined IQC and EQA system reflects a two-tier reliability model analogous to redundant subsystems in Reliability Block Diagrams, where each layer (internal and external control) contributes to the overall system’s resilience and sustained performance over time. This conceptual linkage underlines the robustness of the quality-assurance framework employed in this study.
A. Sociodemographic data
The study involved a population of 15 black individuals, aged 22 to 30 years, with a mean age of 25 ± 2.50 years. The gender distribution was as follows: 8 women (53%) and 7 men (47%). All participants had normal Prothrombin Time (PT) and Activated Partial Thromboplastin Time (APTT) values. PT: between 12 and 14 seconds APTT: between 30 and 34 seconds
B. Biological data
The Table below (Table 1) presents the results of the 30 successive tests performed on the plasma pool collected from the 15 participants. These tests were performed to assess the biological stability of the plasma used as a control.
| Table 1: Values of Prothrombin Time (PT) and Activated Partial Thromboplastin Time (APTT) on the plasma pool (n = 30). | ||
| Test No. | PT (sec) | APTT (sec) |
| 1st test | 12:00 | 28:00 |
| 2nd test | 12:00 | 33:00 |
| 3rd test | 14:00 | 30:00 |
| 4th test | 13:00 | 30:00 |
| 5th test | 13:00 | 30:00 |
| 6th test | 13:31 | 29:00 |
| 7th test | 13:00 | 32:31 |
| 8th test | 13:00 | 30:00 |
| 9th test | 13:15 | 30:00 |
| 10th test | 13:29 | 30:00 |
| 11th test | 13:01 | 29:00 |
| 12th test | 12:11 | 29:05 |
| 13th test | 13:16 | 30:00 |
| 14th test | 13:13 | 29:00 |
| 15th test | 12:00 | 30:29 |
| 16th test | 13:32 | 31:00 |
| 17th test | 12:00 | 30:00 |
| 18th test | 12:16 | 32:00 |
| 19th test | 12:12 | 32:00 |
| 20th test | 12:22 | 31:00 |
| 21st test | 14:05 | 32:12 |
| 22nd test | 13:22 | 32:00 |
| 23rd test | 12:15 | 29:15 |
| 24th test | 13:08 | 31:00 |
| 25th test | 13:12 | 33:09 |
| 26th test | 13:00 | 33:00 |
| 27th test | 13:34 | 32:00 |
| 28th test | 14:00 | 32:16 |
| 29th test | 13:15 | 33:00 |
| 30th test | 13:00 | 33:29 |
C. Analysis of results
Prothrombin Time (PT): Minimum value (12.00 seconds), maximum value (14.05 seconds), range (14.05 – 12.00 = 2.05 seconds), and estimated mean (approximately 13.00 seconds).
Activated Partial Thromboplastin Time (APTT): Minimum value (28.00 seconds), maximum value (33.29 seconds), range (33.29 – 28.00 = 5.29 seconds), estimated mean (approximately 30.66 seconds).
Important Note: The final mean values, standard deviations, coefficients of variation, and graphical interpretation on the Levey-Jennings chart will be presented in the following sections (Discussion and Graphical Analysis) for the assessment of the control pool stability.
D. Presentation of statistical data
a. Mean and Standard Deviation of the Plasma Pool PT and APTT Values
The statistical results from the thirty (30) measurements of the Prothrombin Time (PT) and Activated Partial Thromboplastin Time (APTT) allowed for the calculation of the means, standard deviations (SD), as well as the ±1 SD, ±2 SD, and ±3 SD limits. These data are presented in Table 2.
| Table 2: Means, Standard Deviations, and Coefficients of Variation for PT and APTT (n = 30). | ||
| Parameters | PT values | APTT values |
| Mean | 12:58 | 30:55 |
| SD | 00:38 | 01:32 |
| +1 SD | 13:36 | 32:27 |
| –1 SD | 12:21 | 29:23 |
| +2 SD | 14:14 | 33:59 |
| –2 SD | 11:43 | 27:51 |
| +3 SD | 14:52 | 35:30 |
| –3 SD | 11:05 | 26:19 |
| CV | 5.23 | 4.41 |
b. Interpretation of results
The mean Prothrombin Time (PT) is 12 minutes and 58 seconds (equivalent to 12.97 seconds in decimal form), with a standard deviation of 38 seconds. The coefficient of variation (CV) is 5.23%, indicating good analytical stability for the PT parameter.
The mean Activated Partial Thromboplastin Time (APTT) is 30 minutes and 55 seconds (equivalent to 30.92 seconds in decimal form), with a standard deviation of 1 minute and 32 seconds. The coefficient of variation (CV) is 4.41%, which also indicates good repeatability of the measurements.
Values falling within ±2 SD around the mean are generally considered acceptable according to quality control criteria. These limits will be used to plot the Levey-Jennings chart and interpret the stability of the plasma pool over time based on Westgard rules.
c. Creation of Levey-jennings charts
The statistical results presented in Table 2 were used to plot the Levey-Jennings charts for the Prothrombin Time (PT) and the Activated Partial Thromboplastin Time (APTT), using the mean as the target value and the standard deviations to define the control limits (Figure 1).
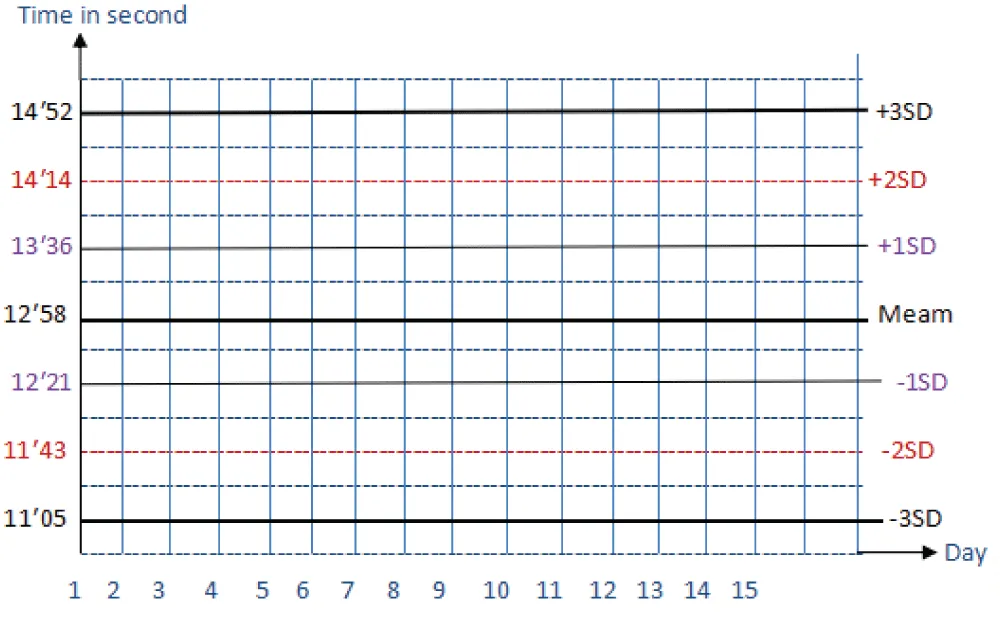
Figure 1: Levey-Jennings Chart for Prothrombin Time (PT).
Based on the collected data, the target value for the PT was determined to be 12 minutes and 58 seconds (i.e., 12.97 seconds). On the chart:
The conformance zone (or acceptability zone) lies between ±2 standard deviations (SD), i.e., between 11 minutes 43 seconds (-2 SD) and 14 minutes 14 seconds (+2 SD).
Values within this range are considered conforming, meaning they are acceptable according to internal quality control criteria.
Any value outside of ±3 SD, i.e., below 11 minutes 05 seconds or above 14 minutes 52 seconds, is considered non-conforming. This constitutes an alarm signal based on Westgard rules and indicates instability of the control pool or a potential analytical Values lying between ±2 SD and ±3 SD correspond to a warning zone, requiring verification or confirmation (re-analysis, review of the procedure, reagent check, etc.).
This interpretation will be used to monitor the daily stability of the pooled plasma and thus determine for how many consecutive days it can be used as a reliable internal quality control (Figure 2 and Table 3).
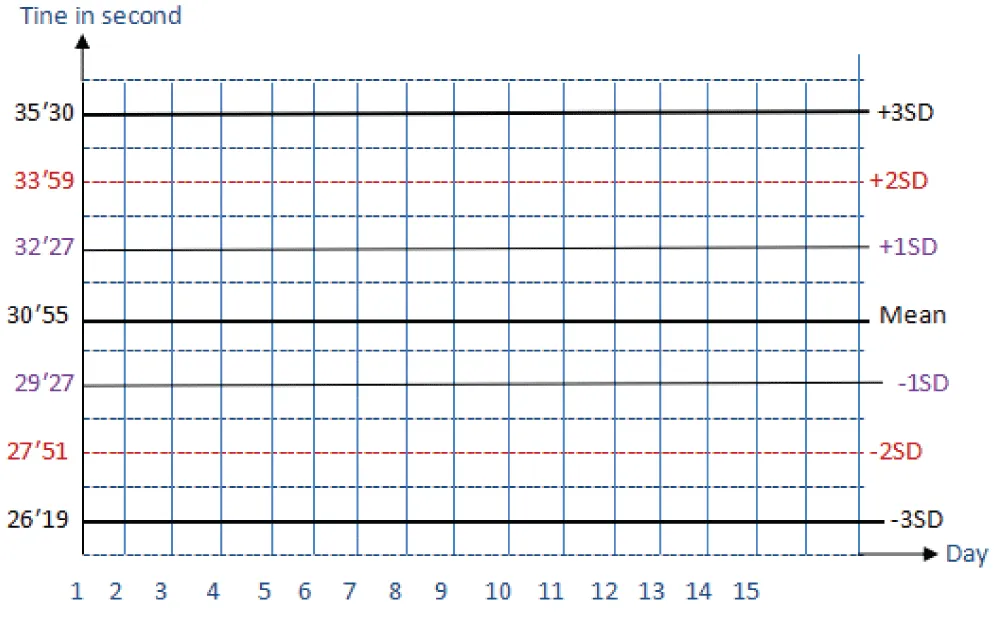
Figure 2: Levey-Jennings Chart for Activated Partial Thromboplastin Time (APTT).
| Table 3: Daily Prothrombin Time (PT) Assays. | ||||||||||||
| 1 day | 2 day | 3 day | 4 day | 5 day | 6 day | 7 day | 8 day | 9 day | 10 day | 11 day | 12 day | 13 day |
| 12′ 45″ |
12′ 42″ |
12′ 7″ |
13′ 04″ |
12′ 9″ |
13′ 60″ |
12′ 59″ |
13′ 21″ |
1 5′ 33″ |
14′ 25″ |
15′ 59″ |
17′ 39″ |
20′ 5″ |
| Note: The result for Day 6 (13'60") has been corrected to *14'00" (since 60 seconds equals 1 minute). | ||||||||||||
The analysis of the Activated Partial Thromboplastin Time (APTT) results allowed for the plotting of the Levey-Jennings chart with a target value (or mean) of 30 minutes and 55 seconds (i.e., 30.92 seconds).
On this chart:
The conformance interval (or acceptable zone) is defined by the limits of ±2 standard deviations (SD): lower limit (27 minutes 51 seconds (–2 SD)) and upper limit (33 minutes 59 seconds (+2 SD)).
→ Any value between 27’57 and 33’59 is considered conforming.
Values located outside of ±3 SD, i.e., below 26 minutes 19 seconds or above 35 minutes 30 seconds, are considered non-conforming and constitute an alarm signal according to Westgard rules. These results may indicate a deterioration of the control plasma, a technical problem, or an analysis error.
Values between ±2 SD and ±3 SD (i.e., from 26’19 to 27’51 and from 33’59 to 35’30) correspond to a warning zone. These cases require verification, particularly of reagents, equipment, or the measurement method.
The Levey-Jennings chart obtained is used to monitor the stability of the “in-house” control pool and to define the maximum storage duration of the plasma while guaranteeing the reliability of hemostasis analyses.
c. Results of Daily PT and APTT Measurements and Application of Westgard Rules
Using the prepared pooled plasma stored at a temperature of –20 °C, Prothrombin Time (PT) and Activated Partial Thromboplastin Time (APTT) assays were performed daily for thirteen (13) days. The objective was to determine the stability duration of the control pool under these storage conditions (Figure 3).
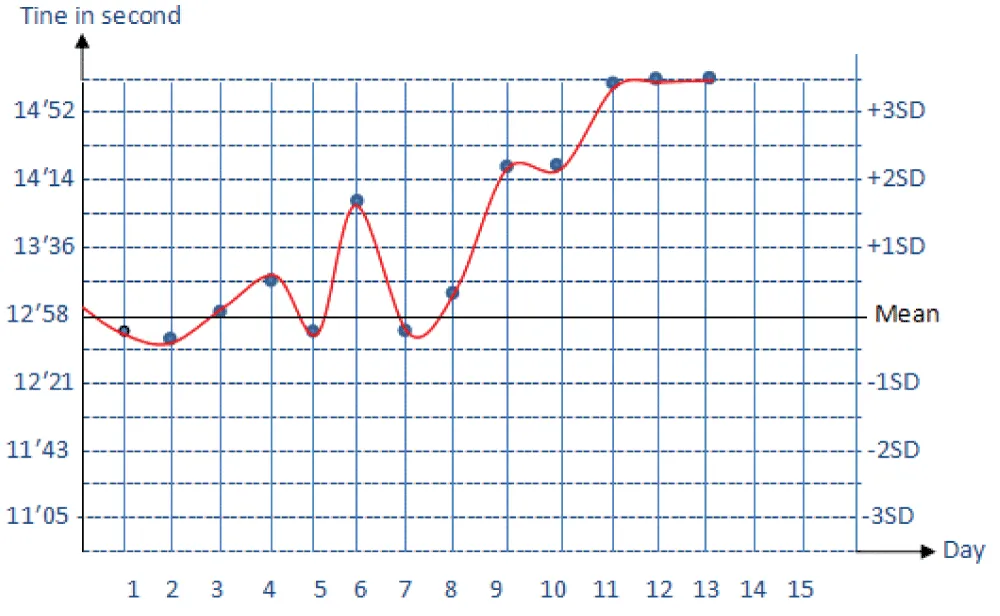
Figure 3: L-J Chart of PT Results after Testing.
Analysis of results according to westgard rules
The target value for PT (derived from the mean of the 30 initial measurements) is 12 minutes and 58 seconds, with a standard deviation (SD) of 38 seconds.
The statistical thresholds are as follows:
±1 SD: 12:21 to 13:36
±2 SD: 11:43 to 14:14
±3 SD: 11:05 to 14:52
Interpretation:
Days 1 to 8: All values fall within ±2 SD, indicating that the plasma pool remains stable during this period.
Day 9 (15:33): The value exceeds the +2 SD threshold (14:14) but remains below the +3 SD threshold (14:52). This is a warning, but not yet a control failure.
Day 10 (14:25): Still beyond +2 SD, with a value close to the +3 SD limit. The trend confirms a progressive drift.
Days 11 to 13 (15:59, 17:39, 20:05): These values exceed the +3 SD threshold, constituting a major non-conformity according to Westgard rules (the 1`3s` rule). The plasma is no longer stable or usable as a control.
Conclusion for Prothrombin Time (PT)
According to the application of Westgard rules:
The pooled plasma is stable for 8 days at –20 °C.
From the 9th day onward, a drift outside acceptable limits is observed, evolving into a total loss of stability by the 11th day.
It is therefore recommended to limit the use of the control pool to 8 days under the defined storage conditions.
The daily Activated Partial Thromboplastin Time (APTT) assay was performed for thirteen (13) consecutive days using the same plasma pool stored at –20 °C, to evaluate its stability duration (Table 4 and Figure 4).
| Table 4: Daily Activated Partial Thromboplastin Time (APTT) Assays. | ||||||||||||
| 1 day | 2 day | 3 day | 4 day | 5 day | 6 day | 7 day | 8 day | 9 day | 10 day | 11 day | 12 day | 13 day |
| 31′ 5″ |
32′ 46″ |
32′ 30″ |
32′ 14″ |
31′ 20″ |
31′ 5″ |
32′ 34″ |
34′ 51″ |
34′ 8″ |
36′ 59″ |
37′ 50″ |
37′ 30″ |
40′ 50″ |
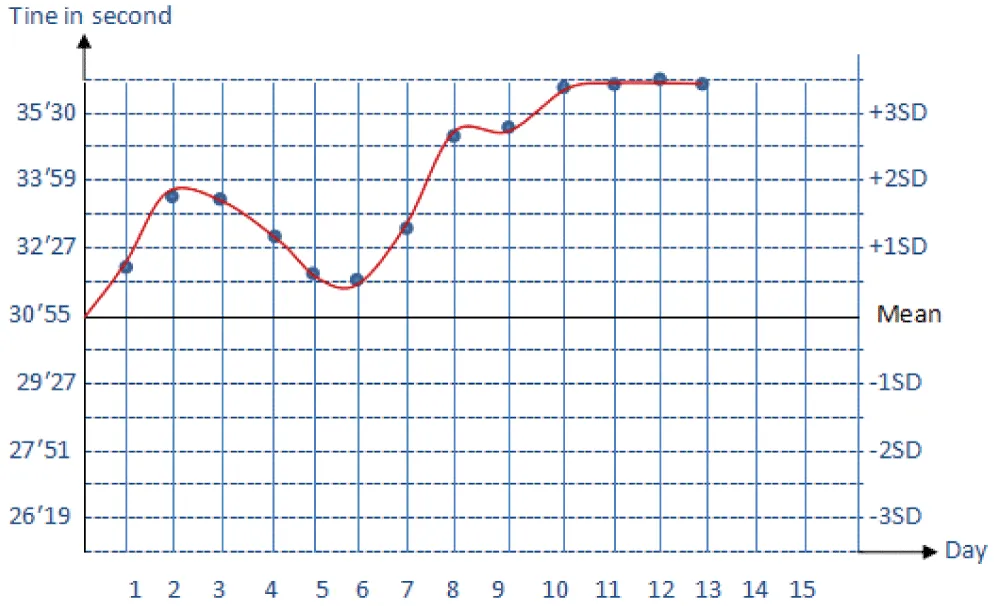
Figure 4: L-J Chart of APTT Results after Testing.
Statistical analysis
Based on previous calculations, the reference mean value for APTT is:
30 minutes 55 seconds (i.e., 30.92 seconds)
With a standard deviation (SD) of:
1 minute 32 seconds (i.e., 1.53 minutes)
Statistical thresholds (Levey-Jennings/Westgard Rules)
±1 SD: 29:23 to 32:27
±2 SD: 27:51 to 33:59
±3 SD: 26:19 to 35:30
Interpretation according to westgard rules
Days 1 to 7: Values are within the ±2 SD zone. The APTT of the pooled plasma is therefore stable during this period.
Day 8 (34:51) and Day 9 (34:08): Values exceed +2 SD (>33:59) but remain below +3 SD (<35:30). This constitutes a warning zone. Verification is required, but stability can still be tolerated conditionally.
Day 10 (36:59), Day 11 (37:50), Day 12 (37:30), and Day 13 (40:50): Values exceed the +3 SD threshold, constituting a major non-conformity (Westgard `1`3s` rule). This indicates control instability and, therefore, the impossibility of continuing to use this plasma pool as a control sample (Table 5).
| Table 5: Conclusion on APTT Stability. | |||
| Parameter | Observed Stability Duration | Start of Drift | Loss of Conformity |
| APTT | 7 days | Day 8 (±2 SD warning) | Day 10 (outside ±3 SD) |
Conclusion: The pooled control plasma used for the APTT assay is reliable for seven (7) days. Beyond this, significant deviations appear, compromising the validity of hemostasis analysis results.
Overall level of precision
The random errors observed were 0% for both Prothrombin Time (PT) and Activated Partial Thromboplastin Time (APTT), which, according to the CAMES Journal - Series A, Vol. 04, 2006, corresponds to the maximum acceptable precision threshold for a normal control plasma. Errors began to appear from day 8 for PT and day 9 for APTT, indicating that the maximum level of precision was maintained until these respective points. Thus, the stability period of the plasma pool extends from day 1 to day 7 for PT and from day 1 to day 8 for APTT.
These findings align with those reported by Okafor, et al. [3] and Kandemir, et al. [4], who demonstrated that in-house control plasma stored at –20 °C typically retains analytical precision for 5–10 days before degradation of coagulation factors becomes significant. Similarly, Grosso, et al. [5] observed that lyophilized control plasmas tend to preserve PT and APTT stability for slightly longer periods, depending on the plasma’s protein composition and freeze–thaw cycles.
Overall level of accuracy
Two types of systematic errors were noted for PT:
Constant errors on days 1 and 2, likely due to handling variability or system stabilization.
Progressive errors from days 9 to 13, probably linked to the degradation of the plasma pool.
For APTT, a constant systematic error was observed between days 1 and 7, still within acceptable limits according to SH GTA 06 [6], followed by a significant deviation from days 9 to 13, indicating loss of conformity likely due to degradation.
Similar degradation timelines were reported by Mbanya, et al. [7], who noted that storage conditions (especially temperature fluctuations and repeated thawing) significantly affect plasma stability and coagulation factor integrity.
Corrective measures implemented, such as reagent verification, strict control of incubation times, and temperature monitoring, are consistent with current best practices recommended by the World Federation of Hemophilia [8] and CLSI guidelines [9] for hemostasis testing quality assurance.
Reliability of the methods used
Precision, a key criterion for internal quality control, was evaluated using the coefficient of variation (CV):
PT: CV = 5.23%
APTT: CV = 4.41%
According to Bernards [10], a CV below 5% is acceptable for precise assays. The present results, therefore, confirm that our locally prepared control plasma pool demonstrates adequate precision and analytical reliability.
These values are consistent with recent studies by Koh, et al. [11] and Adeniyi, et al. [12], which found similar CV thresholds (4% - 6%) for PT and APTT in locally produced quality control materials, suggesting that in-house control preparation can achieve reliability comparable to that of commercial products.
Validation of daily runs
Application of Westgard rules revealed that:
For PT, runs from days 1–7 were accepted, whereas days 9–13 were rejected due to inaccuracy.
For APTT, runs from days 1–8 were accepted, while days 9–13 violated control rules, confirming a loss of result reliability.
This interpretation aligns with Westgard, et al. [13], who emphasized that early detection of systematic deviations through multirule QC remains essential for maintaining analytical integrity, particularly in low-resource laboratories.
Overall quality and performance
The mean values of the normal control pool remained within confidence limits (m ± 2 SD) until day 7 for PT and day 8 for APTT, defining the period of acceptable analytical stability. According to Valdiguié [14], such stability indicates satisfactory analytical quality, while Nyssen [15] associated it with strong procedural control.
Recent findings by Mukwende, et al. [16] similarly support that when locally prepared plasma is properly stored and monitored, its analytical stability can reach or exceed one week, providing a viable alternative where commercial materials are unavailable.
Comparative and practical implications
Compared to contemporary data [3,16], the stability durations observed in this study are consistent with expected ranges for in-house plasma stored at –20 °C. These findings reinforce the feasibility of local control plasma preparation as a cost-effective, sustainable solution for internal quality control in hemostasis testing, particularly relevant for laboratories in resource-limited settings.
The integration of robust QC practices and adherence to updated WFH [8] and CLSI [9] recommendations are essential to maintain result reliability, minimize analytical errors, and ensure patient safety.
The objective of this study was to determine the stability duration of the “in-house” normal control pool for Prothrombin Time and Activated Partial Thromboplastin Time, prepared in the hematology and blood bank laboratory of the Yaoundé University Hospital Centre (Cameroon).
The main conclusions are:
The stability duration of the normal control pool for *Prothrombin Time is 8 days.
The stability duration of the normal control pool for *Activated Partial Thromboplastin Time is 7 days.
These results show that it is possible, under the specific conditions of each laboratory, to prepare a reliable “in-house” control plasma, which helps overcome supply difficulties, shortages, and the high costs of commercial control plasmas.
Recommendations
To improve the management and availability of internal quality control in our laboratories, we recommend:
Continuous training of laboratory staff on the good practices of internal quality control.
Use of the “in-house” control pool for a maximum duration of 7 days for PT and 8 days for APTT.
Validation of the stability duration of the “in-house” normal control pool by other methods or analytical techniques, with comparison of results.
Evaluation of the stability of “in-house” control pools for other coagulation parameters, such as fibrinogen and coagulation factors.
- Accreditation Technical Guide. Quality control in medical biology. SH GTA 06, Revision 00. 2012.
- Adeniyi T. Evaluation of locally produced plasma control materials for hemostasis assays in sub-Saharan Africa. Afr J Lab Med. 2023;12(1).
- Barnet RN. Clinical laboratory statistics. Boston: Little Brown; 1971;70–75.
- Bellucci S. Platelet physiology. In: Medical Surgical Encyclopedia, Hematology. Paris: 1991. No. 13000F10.
- Bernards. Implementation of quality control in the clinical biochemistry laboratory. Paris: Éditions Masson, Biochimie Clinique; 1995;75–6.
- Bio-Rad Laboratories, Inc. QSD09-098 Q-2004. 2009.
- Caen J, Tobelem G. Blood – coagulation. Encyclopædia Universalis [Internet]. 2014 [cited 2025 Jul 27]. Available from: http://www.universalis.fr/encyclopedie/sang-coagulation
- Cazivassilio D. Daily health. [Internet]. 2013 [cited 2025 Jul 27]. Available from: https://www.docteurclic.com/specialistes/docteur-denise-cazivassilio-4.asp
- Charpentier. Blood and blood cells. Paris: Éditions Nathan; 1996. p. 215.
- Clinical and Laboratory Standards Institute (CLSI). H21-A5: Collection, transport, and processing of blood specimens for testing plasma-based coagulation assays. CLSI; 2020.
- Cooper G. Basic lessons of laboratory quality control. Bio-Labo; 2009. Available from: https://studylib.net/doc/8251031/basic-lessons-in-laboratory-quality-control
- Grosso S. Assessment of lyophilized plasma stability for coagulation testing. Clin Chem Lab Med. 2020;58(11).
- Kandemir F. Stability of frozen plasma control materials for PT and APTT testing. J Lab Med. 2023;47(2).
- Koh J. Internal quality control performance of in-house coagulation plasma controls. Int J Hematol. 2020;111(5).
- Lebeau JP. Daily health. [Internet]. 2010 [cited 2025 Jul 27]. Available from: https://www.docteurclic.com/specialistes/docteur-jean-pierre-lebeau-41.aspx
- Lilbey J. Platelet immunology: fundamental and clinical aspects. London: Euro Text; 1991.
- Martin A. Quality control. In: Introduction to the medical biochemistry laboratory. Paris: Éditions Ellipses; 1995;18–25.
- Mbanya D. Improving laboratory quality systems in Cameroon: the challenge of local QC materials. Pan Afr Med J. 2022;42(55).
- Medical Dictionary. 6th ed. BOHAWES; 2011.
- Mukwende P. Comparative stability of commercial and locally prepared plasma controls in hemostasis testing. PLoS One. 2024;19(2).
- Nyssen M. Statistical quality control of examinations. In: Quality control of laboratory examinations. Journées nationales de biologie; 1971;43–51.
- Okafor E. Analytical stability of in-house plasma controls in routine coagulation testing. Afr J Biomed Res. 2021;24(3).
- Professional Order of Medical Technologies of Quebec. Avenue H2T 1G2. 2008. Email: [email protected]. Available from: https://www.optmq.org
- Revue CAMES – Série A. 2006;4.
- Tobelem G. Platelet–vessel wall interactions. Paris: Laboratoire Millot; 1980–1987.
- Valdiguie P, de la Farge F, Solera ML. Quality control of results in the clinical biochemistry laboratory. Rev Med Toulouse. 1998.
- Westgard JO. Modern quality control: applications of multirule QC in clinical laboratories. Am J Clin Pathol. 2020;153(1).
- World Federation of Hemophilia (WFH). Extract published by the WFH. 2010.
- World Federation of Hemophilia (WFH). Guidelines for the management of hemophilia. 3rd ed. 2021. Available from:https://www1.wfh.org/publications/files/pdf-1864.pdf
- World Health Organization (WHO). Transfusion safety fact sheet. Geneva: WHO; 2007. Available from: https://www.who.int/publications/i/item/WHO-EHT-08.03
- World Health Organization (WHO). Fact sheet. 2012. Available from: https://www.who.int/mediacentre/facts/fs204/index.html